

Sewershed Mapping Activity
The benefits of green infrastructure extend beyond stormwater management. The planning effort to support green infrastructure installation near schoolyards itself can involve students, teachers, and community members. The sewershed mapping activity described on this page promotes environmental education when teachers and students apply science, technology, engineering, art (photography), and math skills to support the design of a project that can benefit the environment surrounding their school in the real world.
The activity described in the video above and supported by the Word document templates linked below guides a teacher (grades 7-12) in supporting their students to convert analog observations of a surrounding neighborhood sewershed* into a digital storytelling product.
*A sewershed is the area where water drains into a single point of the sewer system. In the Escuela Verde example cited on this page, for example, it is the area around a single alley in which stormwater flows into a single storm drain. A sewershed is analogous to the concept of a watershed, which is the area of land that drains into a single body of water, except the contours and catchment of a sewershed are defined by a constructed landscape while a watershed is mainly result of natural contours and water bodies. Both sewersheds and watersheds are examples of basins, with boundaries defined at different scales for different systems.
The mapping activity is more than simply an exercise. The data gathered and maps created from fieldwork directly inform design parameters for sizing the green stormwater infrastructure that receives stormwater from the sewershed. The lesson plan template linked below guides student teams in observing, ascertaining, and communicating hyperlocal sources of water pollution under existing land-use conditions (water quality) and in directly observing, estimating, measuring, and calculating quantitative parameters of catchment areas that inform green infrastructure project designs (water quantity).
The result is an interactive map shared in Google Earth that connects water quality and water quantity considerations.
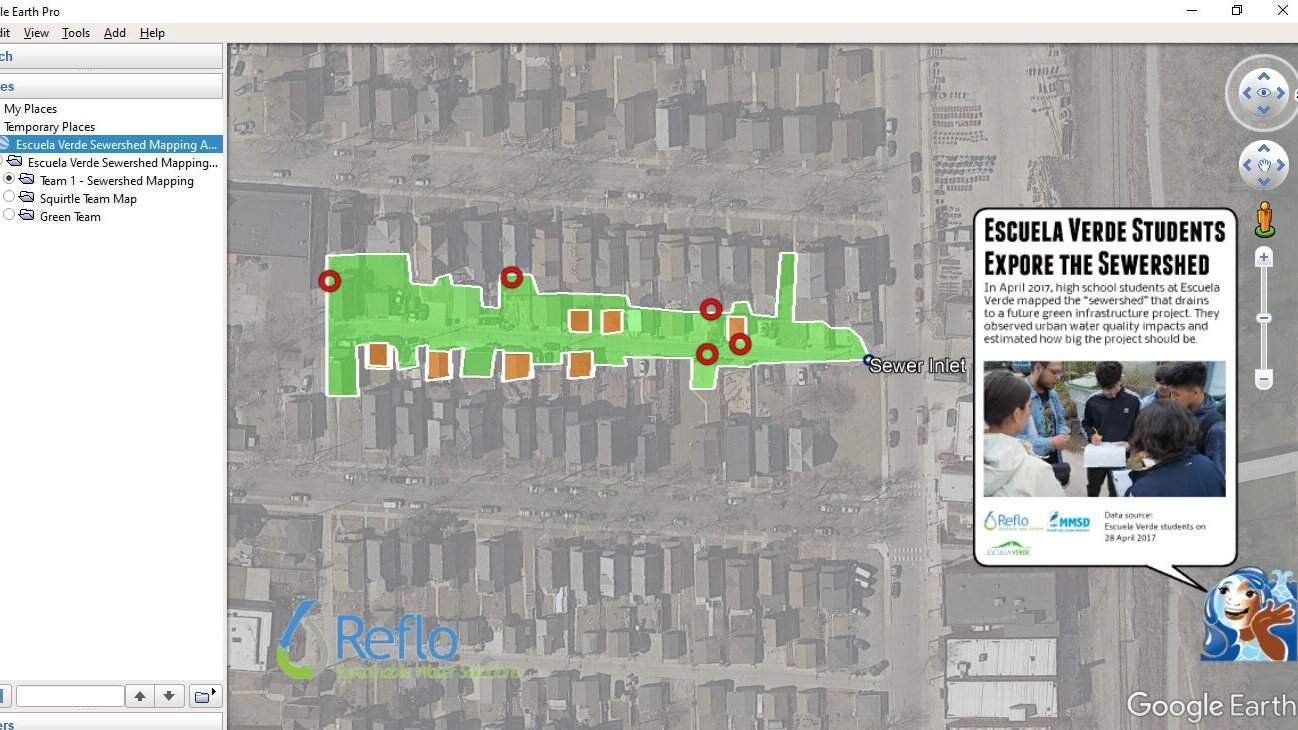
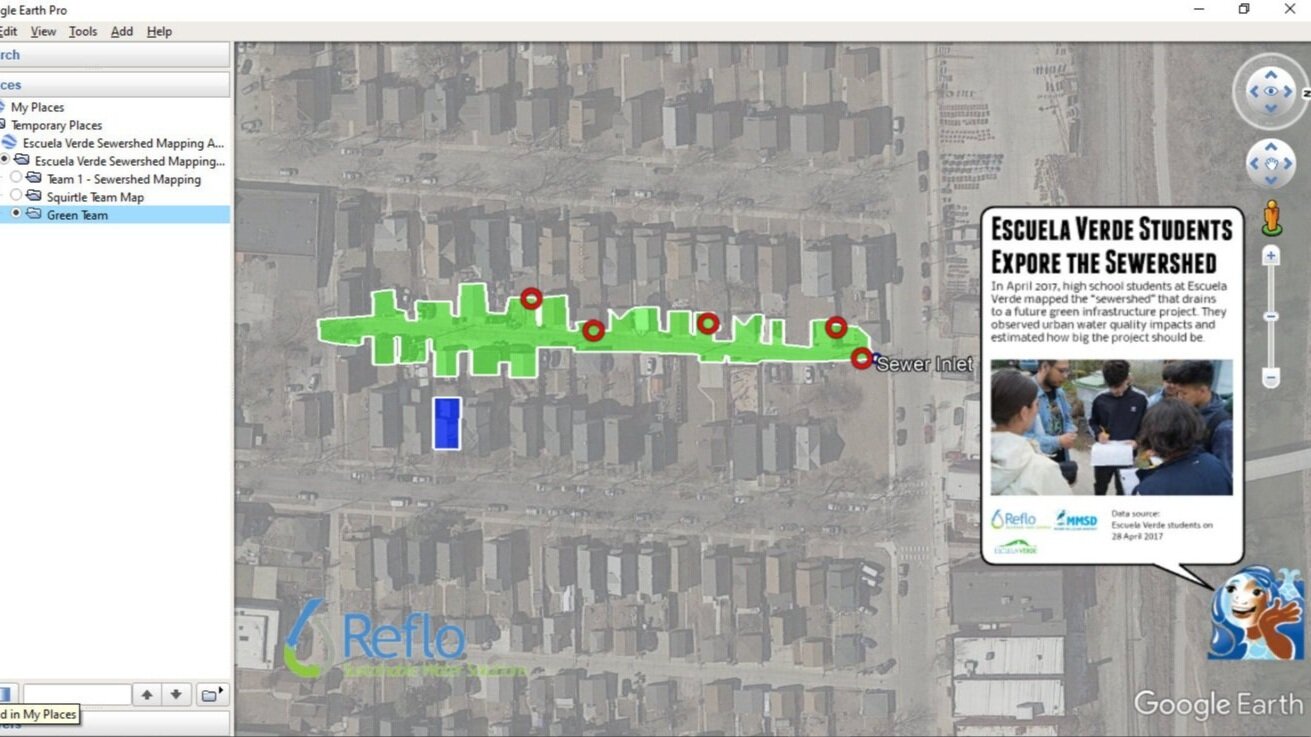
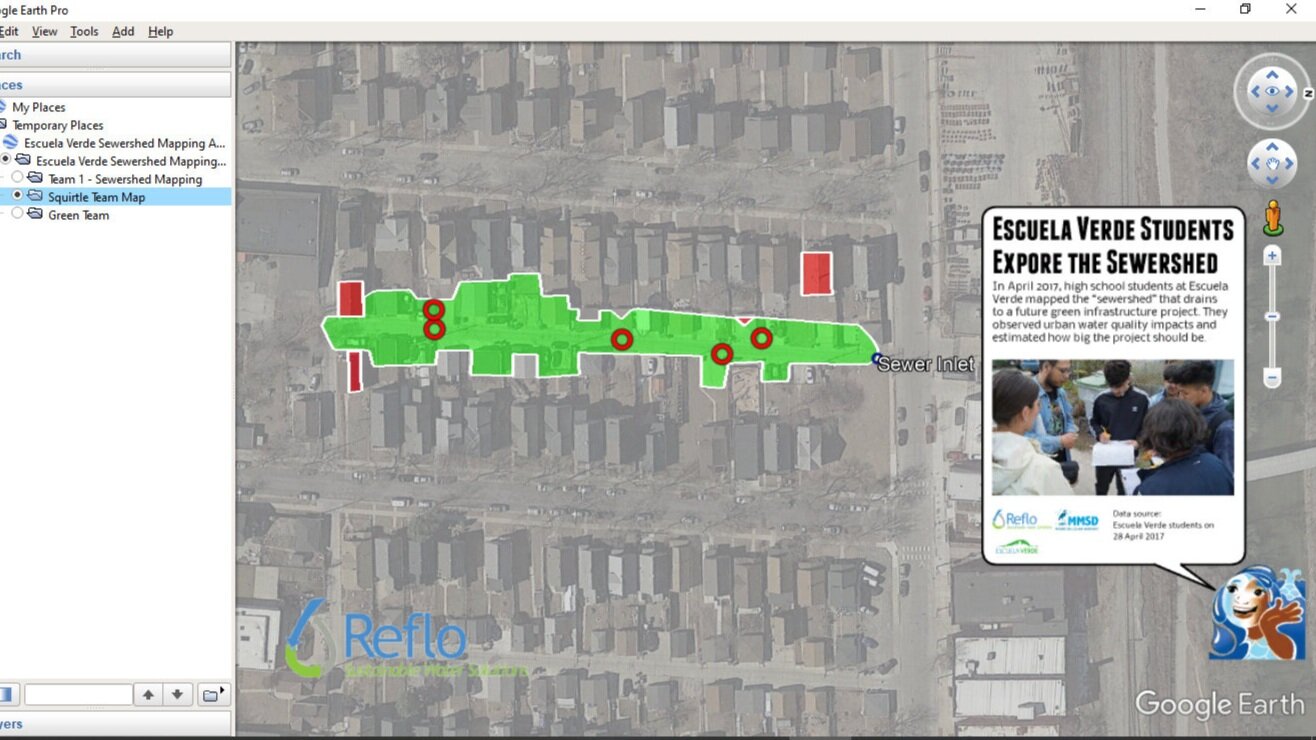
The activity described was conducted at Escuela Verde, a Milwaukee charter high school in the Menomonee River watershed, in April 2017 with support of Escuela Verde teachers and staff from the nonprofit Reflo and the Milwaukee Metropolitan Sewerage District. In a little under three hours, three student teams went from field observations to presenting their interactive maps to their entire school.
We have linked the supporting documents so you can download and use them as templates to support sewershed mapping activities at or around your own school or community center. All you need are some clipboards, cameras, observational skills, and access to Google Earth Pro on Desktop, a free program you can download onto any computer. You can use our free Milwaukee Story Mapper to create the annotated placemarks with field photos. You can use Google Earth itself to draw sewershed polygons. In the Milwaukee area, you can also overlay your school’s sewershed maps with the Milwaukee Community Map to understand your sewershed’s relationship to the combined and separated sewer areas, your local river watershed, historic changes to waterways, and so much more!
Who knew planning green infrastructure projects could be so much fun?
Download the Templates

5-page Lesson Plan

Water Quality Photo Log

Water Quantity Worksheet & Photo Log
For questions about the lesson plans or to inquire about Reflo supporting your activity, contact Lisa Neeb.