Climate Change & You
How Do We Know?
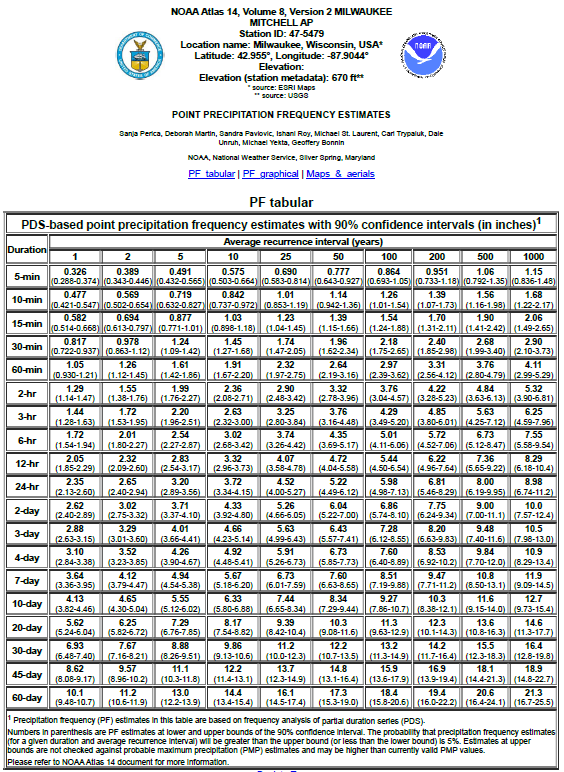
You may also hear the term NOAA -- that stands for National Oceanic and Atmospheric Administration. It's the federal entity within the Commerce Department that employs scientists who study, monitor, and know a lot about weather, climate, and water. One thing NOAA does is keep precipitation data for the nation, including Milwaukee and Wisconsin. It is called the NOAA Precipitation Atlas.
This is a source to track historical records of rainfall data from places over time. It is the source for local comparison when you hear people talk about "record" high or low temperatures or "record" rainfall or snowfall. Those aren't just words. They help us understand the range of data. This helps us understand how extreme different measurements are compared to the historical record. Here is the link to the stations in Wisconsin. You can click on the record for Milwaukee's Mitchell Airport. There are three other stations in Milwaukee.
When you hear people talk about a 1,000-year storm or a 100-year storm, do you know what this means?
These terms are based on statistics, or a mathematical analysis of patterns of measured events. A series of measured events is a "record" of data points. Each point represents a measurement -- someone making an observation about the real world and recording it. In the case of a 100-year storm, this means that -- based on an analysis of storms previously recorded in one place and how big they were -- we statistically expect a 1-in-a-hundred chance that any storm will be that big in a given year. So, if someone lived a hundred years, that person statistically would expect to witness one such storm. A storm of that magnitude would statistically "recur" every 100 years.
Another way to think about it is in terms of cash money. Let's say we showed you 100 dollar bills and let you mark one with a red X, then we put all the dollars into a box and shake them up. What are the chances on any single grab into the box that you pull out that particular dollar bill? 1 in a 100. That's how statistically likely a 100-year storm is for a given area, given the history of evidence for the location. Now, imagine a 1,000-year event. That's like grabbing that same dollar bill from a thousand in the box. Based on historical data, it is expected to have a low recurrence interval (1 in a thousand years) meaning it is quite rare.
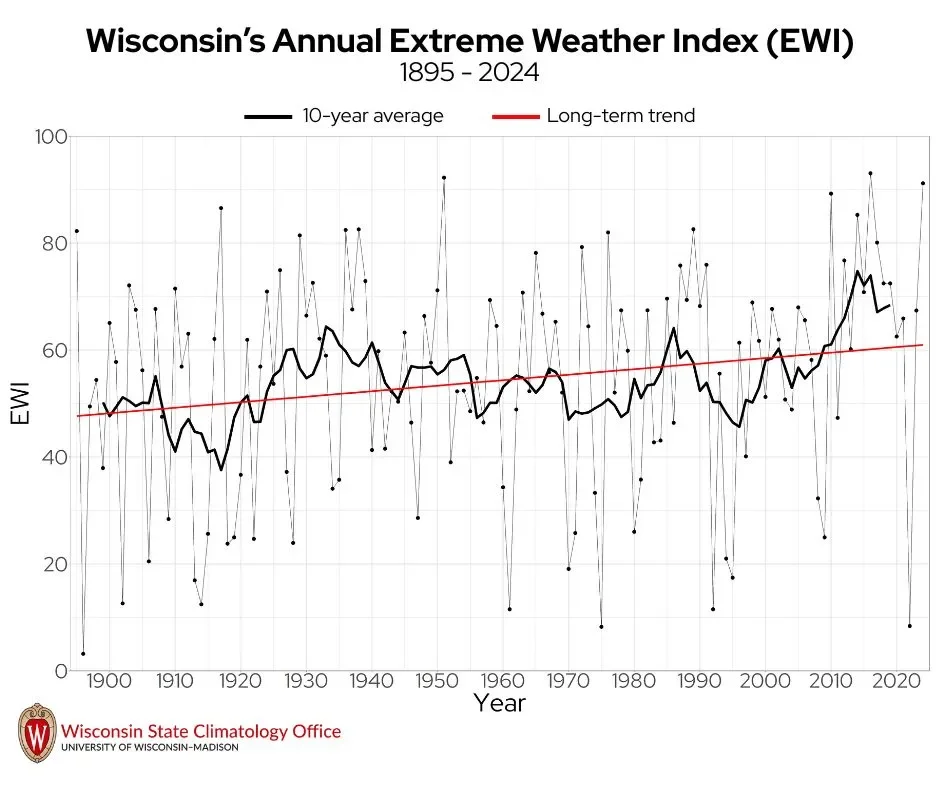
But statistics is only as good as data collected and analyzed for frequency distribution patterns. And the past few decades of intense storms have ranked beyond where the previous table of expected recurrence predicts. (There have been more such storms than the previous record would suggest.) So, incorporating more recent extreme events into a longer more comprehensive data set would seem to suggest such intense storms are actually or are becoming more frequent than the older statistics suggests. These observations are consistent with climate change expectations for our region. The analogy would be like marking 10 or 20 or 40 dollar bills with a red X and then shoving your hand in the money box. Much more likely than if only 1 were marked.
The resources linked to this page can help you to understand these terms and open a discussion for how stormwater engineers and others are adapting to the evolving observations about the frequency of extreme precipitation.